A closer look at the Smart Australian Top 200 ETF
Australia – Our ‘local’ global market.

Overview
Australia is often seen as New Zealand’s most accessible international market – geographically close but offering greater scale and a wider range of companies. The Smart Australian Top 200 ETF gives investors a simple way to invest in Australia, providing access to 200 of the largest companies listed on the Australian Securities Exchange via a fund listed on the NZX.
Key features
Portfolio of 200 leading Australian companies with the purchase of one security, which is listed on the NZX
Dividend yield of 2.68%1
Annual fund charge 0.30%
Convenience of a listed Portfolio Investment Entity (listed PIE)
Listed Portfolio Investment Entity
The Smart Australian Top 200 ETF is a listed PIE and is taxed at a rate of 28%. The PIE tax rules can simplify tax compliance for investors by allowing PIE-compliant funds to manage tax obligations at the fund level. Distributions received from a Smart ETF will not generally need to be included in your income tax return.
However, if you are a New Zealand tax resident currently paying tax at a rate less than 28%, you may benefit from including the fully imputed portion of distributions from a Smart ETF, including any bonus issues, in your tax return. Doing so could allow you to use the excess tax paid by the Smart ETF to reduce the tax payable on other income you’ve earned throughout the year.
Performance
Benchmark
The Smart Australian Top 200 ETF’s investment objective is to track the return of the S&P/ASX 200 Total Return Index.2 The S&P/ASX 200 Index is designed to measure the performance of the 200 largest index-eligible stocks listed on the ASX by float-adjusted market capitalisation. It is widely considered Australia’s preeminent benchmark index.3 The performance of this fund and its benchmark is shown below. Over three years, the fund’s tracking difference versus its benchmark is +0.04% per annum.

Past performance is not a reliable indicator of future performance. Investment returns can fluctuate and may be negative, even over the minimum suggested investment timeframe of 5 to 10 years and longer.
Source: Smart. These returns are calculated using Net Asset Value (NAV), not market price.
Income
Like New Zealand, Australian shares overall currently provide a higher dividend yield than global shares. The Smart Total World ETF is trading on a gross dividend yield of 1.21%, and the Smart Australian Top 200 ETF’s gross yield is 2.68%.1 This dividend yield may appeal to income-oriented investors.
The Smart Australian Top 200 ETF pays distributions twice a year in June and December. Distributions are paid in New Zealand dollars and automatically reinvested for you, unless you choose to receive them in cash. Distributions paid since 2022 are shown in the chart below.
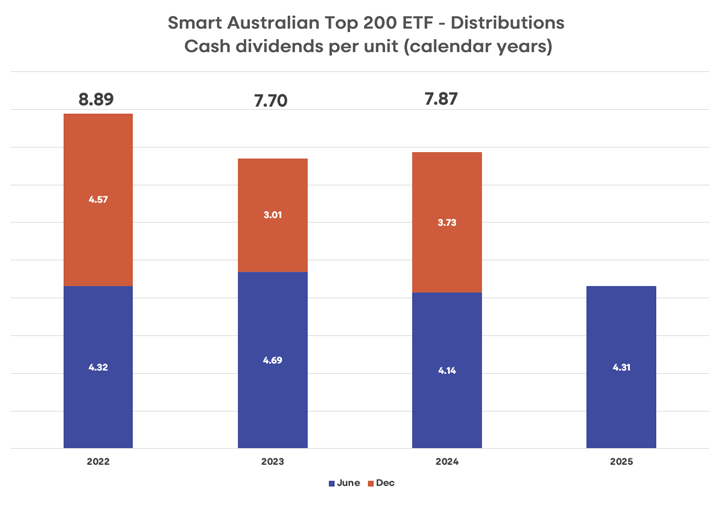
Source: Smart.
Australian shares in a portfolio
A global market
Australia’s proximity to New Zealand means some New Zealand investors may regard it as a quasi-local market. However, because Australia and New Zealand are separate countries, and the ASX is distinct from the NZX, Australia is most appropriately viewed as a global market.
Also, Australian shares tend to move more in line with global shares than New Zealand shares do. Over the past 20 years, the correlation between monthly returns from New Zealand and global shares has been just 0.53. By comparison, the Australian market has behaved more like global markets, with a correlation of 0.68.4
How much of a share portfolio should be invested in Australian shares?
Australia represents 1.73% of the FTSE Global All Cap Index.5 Many New Zealand investors may have a higher allocation than this to Australian shares. For instance, KiwiSaver funds, on average, have 7.7% of their share portfolios allocated to Australian shares (with 19.6% invested in New Zealand shares and 72.6% in global shares).6 How much an investor chooses to allocate to Australian shares will depend on their goals, risk profile and preferences.
A closer look at the S&P/ASX 200 Index
One of the world’s leading markets
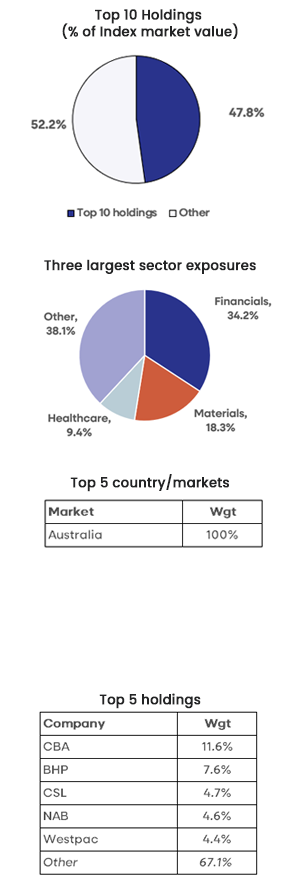
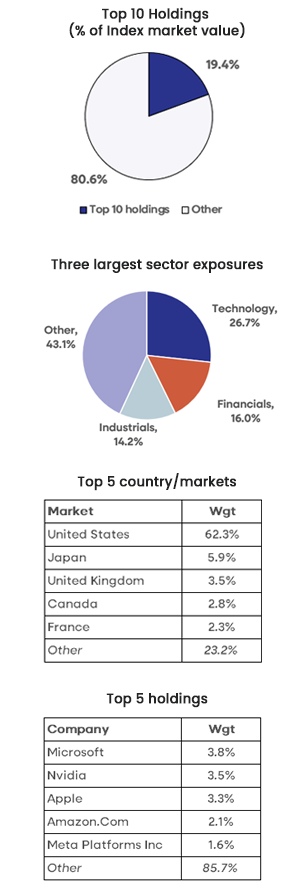
Australia is the 11th largest market in the FTSE Global All Cap Index. The companies in the S&P/ASX 200 Index have a combined market value of NZ$2,923 billion.7 Some of the companies in the index are world leaders in their industry, such as BHP and CSL. The top 10 companies represent 47.8% of the index and are profiled below.
S&P/ASX 200 Index - Top 10 holdings
| Company | Sector | Weight (%) | Profile |
|---|---|---|---|---|
1. | Commonwealth Bank (CBA) | Financials | 11.6 | One of the four leading banks in Australia with more than 17 million customers. Focuses on providing retail and commercial banking services in Australia, and in New Zealand through its subsidiary, ASB. |
2. | BHP Group (BHP) | Materials | 7.6 | The world’s largest mining company by market capitalisation. Key products include iron ore, copper and metallurgical coal, along with nickel and potash. Listed on the ASX in 1885. |
3. | CSL Ltd (CSL) | Health Care | 4.7 | CSL is a global biotechnology company with patients in more than 100 countries and employs 32,000 staff. Its portfolio of products includes those that treat hemophilia and immune deficiencies, vaccines to prevent influenza, and therapies in iron deficiency and nephrology. CSL was established in 1916 and listed on the ASX in 1994. |
4. | National Australia Bank (NAB) | Financials | 4.6 | Australia’s largest business bank. Has 38,000 staff and 8.5 million customers across Australia and overseas. The majority of operations are in Australia and New Zealand (NAB owns BNZ), with other businesses located in Asia, the UK and the US. |
5. | Westpac Bank (WBC) | Financials | 4.4 | Westpac is Australia’s first bank and oldest company. Established in 1817 as the Bank of New South Wales, the company changed its name to Westpac Banking Corporation in 1982. It provides a range of consumer, business and institutional banking and wealth management services. |
6. | Wesfarmers (WES) | Consumer Discretionary | 3.7 | Established in 1914 and based in Perth, Wesfarmers is a diversified corporation operating in a range of areas including home improvement (Bunnings), building materials, office and technology products, health and beauty products, distribution of pharmaceutical goods, manufacturing of chemicals and fertilisers and gas processing and distribution. |
7. | ANZ Group (ANZ) | Financials | 3.4 | ANZ is among the top 4 banks in Australia and the largest banking group in New Zealand and the Pacific. Provides banking and financial products and services to over 8.5 million retail and business customers and operates across close to 30 markets. Listed on the ASX in 1969. |
8. | Macquarie Group (MQG) | Financials | 3.0 | A global financial services group operating in asset management, retail and business banking, wealth management, as well as advisory, and risk and capital solutions across debt, equity, financial markets and commodities. Operates in 31 markets and has 19,700 staff globally. |
9. | Goodman Group (GMG) | Real Estate | 2.6 | The largest property group listed on the ASX. Owns and maintains $85bn commercial property portfolio of 431 properties across 15 countries across Asia Pacific, Europe and the Americas. Also involved in providing data centre property projects across 13 cities around the world. |
10. | Telstra Group (TLS) | Communication Services | 2.2 | Australia’s leading telecommunications company. Provides a full range of products and services, including 22.5 million retail mobile services and 3.4 million retail bundle and data services. Listed on the ASX in 1997. |
| Total |
| 47.8 |
|
Sources: Company websites. iShares. As at 31 May 2025.
High weighting to financials and materials
An important aspect of the Australian market investors should be aware of is the dominance of the financials (such as the banks) and materials (such as mining) companies in the index. Together, these two sectors represent 53% of the index. Healthcare is the third largest sector with a weighting of 9.4%. See the chart below. This concentration in financials and materials can be reduced across a portfolio by combining the Smart Australian Top 200 ETF with other funds which provide exposure to other markets and have a different mix of industries.
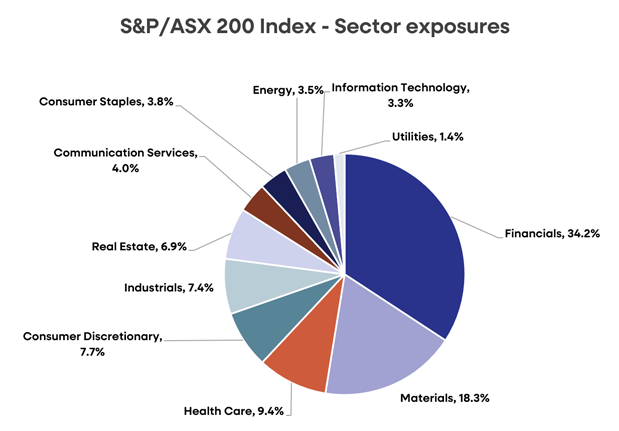
Source: S&P Dow Jones Indices. S&P/NZX 50 Index Factsheet, 30 May 2025
Combining funds to build a diversified share portfolio
A primary goal of investing is to generate the highest possible return for the lowest risk. Diversification can help obtain this balance. Spreading investments across asset classes (such as cash, fixed income and shares), countries, sectors and companies, can lower a portfolio’s risk profile as the poor performance of one investment can be offset by stronger performance in another, and vice versa. It is important to note that diversification and asset allocation does not fully protect a portfolio from market risk.
To build a diversified share portfolio, investors could consider combining the Smart Australian Top 200 ETF with other funds such as the Smart S&P/NZX 50 ETF and the Smart Total World ETF. Together, these three funds provide broad exposure to Australian, New Zealand, and global shares, offering diversification across regions, sectors and companies.
The table below outlines a selection of key details on each of these ETFs, illustrating how they can complement each other in a diversified portfolio.
Selected key details
ETF | Smart S&P/NZX 50 ETF | Smart Australian Top 200 ETF | Smart Total World ETF |
|---|---|---|---|
Ticker | NZG | AUS | TWF |
Dividend yield2 | 2.59% | 2.68% | 1.21% |
Distributions | June / December | June / December | June / December |
Annual fund charge | 0.20% | 0.30% | 0.40% |
Benchmark index | S&P/NZX 50 Gross with Imputation Index | S&P/ASX 200 Total Return Index | FTSE Global All Cap Index |
Number of stocks (companies) in the index7 | 50 | 200 | 10,015 |
Total value of stocks in the benchmark index (NZD) | $152 billion | $2,923 billion | $151,575 billion |
Smart S&P/NZX 50 ETF | Smart Australian Top 200 ETF | Smart Total World ETF |
|---|---|---|
|
|
|
This example portfolio does not take into account the investment objectives, financial situation, or particular needs of any particular person. Accordingly, before making any investment decision, Smart recommends seeking professional assistance from a licensed Financial Advice Provider.
Consider the risks
All investments involve risk. Purchasing Smart ETFs does not guarantee a profit and the value of your investments can go down as well as up. The unit price of each Smart ETF can go up and down and units can trade at a discount or a premium, which means the purchase price of a unit can differ from the value of the underlying fund assets. A more comprehensive description of the risks in this type of investment can be found in the relevant Product Disclosure Statement.
Footnotes
Dividend yields are as of 30 June 2025 and sourced from Smart. Calculated by summing the prior 12-month distributions (including imputation credits) divided by the market price at the end of each business day. Past performance is not a reliable indicator of future performance.
Smart Exchange Traded Funds Core Series Product Disclosure Statement, 10 October 2024
S&P Dow Jones Indices. S&P/ASX 200 Factsheet, 30 May 2025.
Bloomberg. Monthly returns from 31 May 2005 to 31 May 2025 for the S&P/NZX All Index, MSCI World Index and Australian All Ordinaries Index. Correlation is a measure of how two markets or securities move in relation to each other. It is measured on a range from +1.0, which means they are perfectly correlated and move in unison, to -1.0, which indicates they move in opposite directions. A correlation of zero means the two markets are not correlated.
FTSE Russell. FTSE Global All Cap Index Factsheet, 30 May 2025.
Morningstar KiwiSaver Survey, March 2025
S&P Dow Jones Indices. S&P/ASX 200 Factsheet, 30 May 2025. NZD value of companies in the S&P/ASX 200 Index calculated by Smart.
Index data sourced from S&P Dow Jones Indices and FTSE Russell. Information as at 30 May 2025.
Disclaimer
This information is issued by Smartshares Limited (Smart), a wholly owned subsidiary of NZX Limited. Smart is the issuer and manager of the Smart Exchange Traded Funds. The product disclosure statements are available at smartinvest.co.nz.
Past performance is not a reliable guide to future performance. The calculations and returns used in this article are illustrative and intended as a guide only, and are not an indicator of future returns. The value of investments can go down as well as up and investors may not get back the full amount invested nor any particular rate of return referred to in this article. Returns are not guaranteed.
This information is intended to provide a general guide and is based upon, and derived from sources Smart considers reliable. Neither Smart nor NZX Limited, or their respective directors and employees accept any liability for any errors, omissions, negligent misstatements, or for the results of any actions taken, or not taken in reliance on this information.
This information is not a substitute for professional advice. In preparing this information Smart did not take into account the investment objectives, financial situation or particular needs of any particular person. Accordingly, before making any investment decision, Smart recommends seeking professional assistance from a licensed Financial Advice Provider.
Related articles
 A closer look at the Smart US Technology (NZD Hedged) ETFThe Smart US Technology (NZD Hedged) ETF provides targeted exposure to some of the world's most influential and innovative companies.
 Emerging Markets: A strong opportunity for 2026 Smart Chief Investment Officer, Stuart Millar shares his view on emerging markets and why they are on our radar for 2026.
  Why global markets are looking beyond the oil shockGlobal share markets have held firm despite rising oil prices and Middle East tensions. Marek Krzeczkowski, Head of Investment Strategy & Quant, explo...