Beyond America: Broadening your global portfolio with Smart’s regional funds
Explore how Smart’s regional funds can help you build a balanced global portfolio.

From Asia to Europe, Smart’s regional funds let you shape your own global portfolio to suit your goals.
Why this matters
Global investing is about spreading your risk and capturing opportunities across different parts of the world. In recent years, the strong performance of US technology stocks has significantly increased the US market’s share within many global portfolios.
For investors seeking to broaden their international exposure, the Smart regional ETFs offer a flexible way to rebalance and tailor global portfolios. These funds can be used alongside other global or US-focused funds to support broader diversification.
Smart’s range of regionally focused ETFs include:
• Smart Europe ETF (EUF),
• Smart Asia Pacific ETF (APA),
• Smart Emerging Markets ETF (EMF).
Note: In this article we focus on Smart ETFs, but you can also access the same global and regional exposures through the SuperLife range of unlisted funds - giving investors flexibility in how they invest1.
From large to dominant - the rise of the US market
The performance of the US market has been striking. Over the past five years to 29 August 2025, the Smart US 500 ETF has returned 17.61% per annum (after fees, before tax). Over the same period, the Smart Europe, Asia Pacific and Emerging Markets ETFs have delivered an average annual return of 10.77% per annum.2
This outperformance of the US goes back further than five years. The strong outperformance of the US market relative to other markets over the past 16 years has seen its weighting in the Vanguard Total World Stock ETF (which is the underlying fund held by the Smart Total World ETF to track the index) grow from 44% in March 2009 to 63.0% in August 2025.
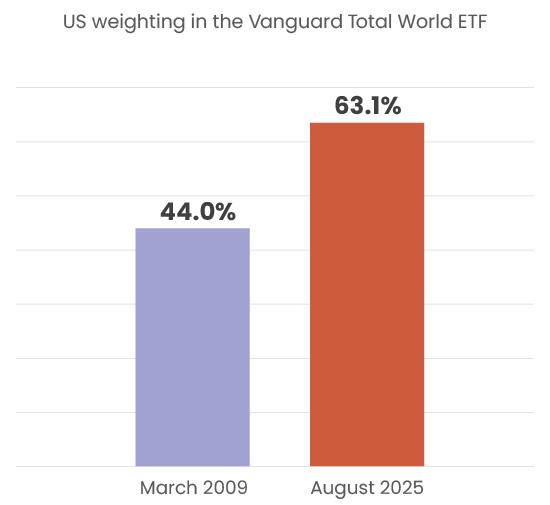
Source: Morningstar (VT – Vanguard Total World Stock ETF – ETF Stock Quote | Morningstar), Vanguard Total World Stock ETF Market exposures as at 31 August 2029.
The US market performance has been propelled by technology companies. The so-called ‘magnificent seven’3 technology companies are all among the top 10 holdings in the FTSE Global All Cap Index (this index is the benchmark for the Smart Total World ETF), and they dominate not only the US market, but also global markets.
The scale of these companies is illustrated by the fact that their combined weighting in the FTSE Global All Cap Index almost matches the weighting of the next six largest global markets in the index after the US.
The scale of the US tech stocks in context
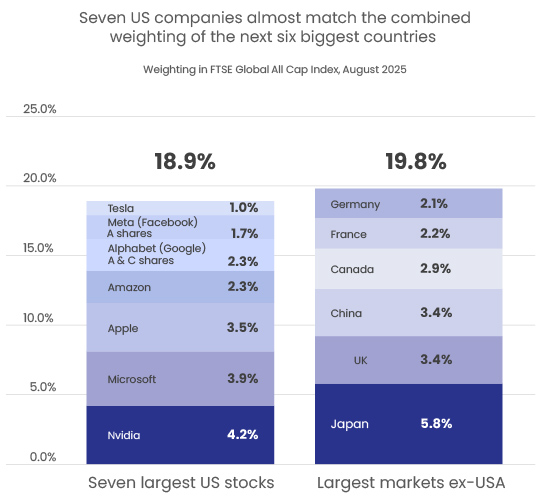
Source: FTSE Russell. FTSE Global All Cap Index Factsheet, 29 August 2025
The rise of the US technology stocks has meant the FTSE Global All Cap Index now has a weighting to the US market of 63.0%, which is more than 10 times larger than the second largest market, Japan, which has a weighting of 5.8%.
FTSE Global All Cap Index – Market exposures
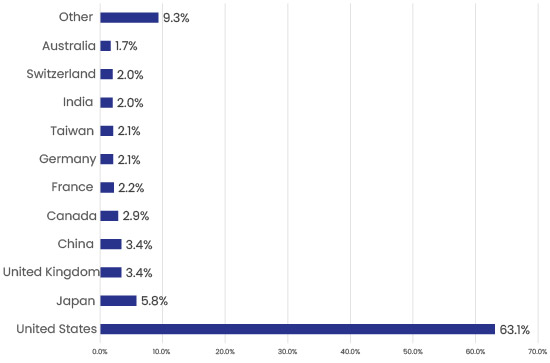
Source: FTSE Russell. FTSE Global All Cap Index factsheet, 29 August 2025.
The regional weightings reflect the size of the US market. North America (which includes both the US and Canada) represents 66.0% of the portfolio.
Smart Total World ETF – Regional exposures
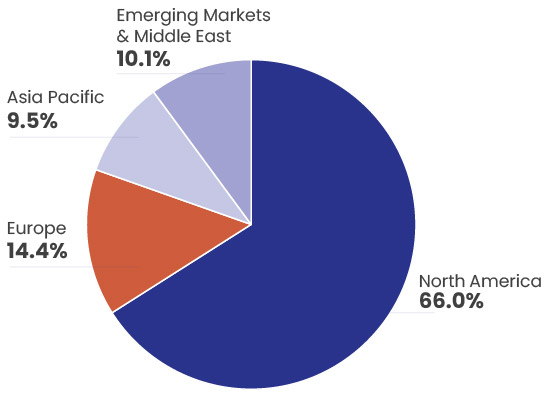
Source: FTSE Russell. FTSE Global All Cap Index factsheet, 29 August 2025.
Smart’s regional ETFs at a glance
When designing a global portfolio, some investors may prefer to hold a single, globally diversified fund, such as the Smart Total World ETF. Some may choose to combine regionally focused funds, while others may use a mix of both.
For those seeking specific exposure to the US market, Smart offers a range of US-focused funds, including the Smart US 500 ETF, which holds 500 of the largest US-listed companies.
To access markets outside the US, Smart has three regional ETFs which offer exposure to different global regions. These can be used in combination with other funds to build a globally diversified portfolio.
We provide short profiles of these three regional ETFs below. For more information on these funds, and the other funds mentioned in the article, please refer to the Smart website, and the Product Disclosure Statement, available here.
Please note, when designing a portfolio, investors should consider their own personal circumstances and seek advice from a licensed financial adviser provider.
Smart Asia Pacific ETF
Established in July 2015, the Smart Asia Pacific ETF (APA) is designed to track the return (before tax, fees and other expenses) of the FTSE Developed Asia Pacific All Cap Index. The annual fee is 0.55%.4 The fund holds the US-listed Vanguard FTSE Pacific ETF.
The Index is comprised of large, mid and small capitalisation companies located in Japan, Australia, South Korea, Hong Kong, Singapore and New Zealand. Japan is the largest exposure with a 60.2% weighting. Clients should note the 18.1% weighting to Australia and consider this alongside any other Australian exposures in their portfolio. There is also a small weighting to New Zealand of 0.6%.
There are 2,325 individual companies in the portfolio. The top 10 holdings represent 16.6% of the portfolio. The five largest companies are Samsung Electronics, Toyota Motor Corp, Commonwealth Bank, Mitsubishi UFJ Financial Group and Sony.5 Find out more about the Smart Asia Pacific ETF here.
Smart Asia Pacific ETF – Market exposures
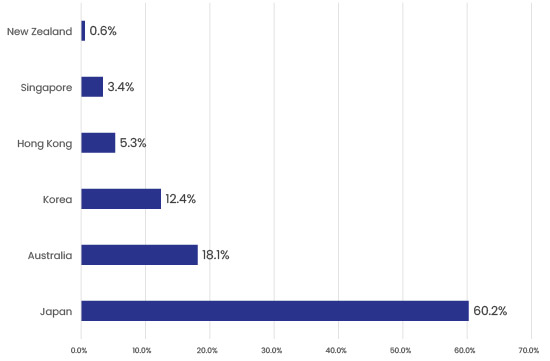
Source: FTSE Russell. FTSE Developed Asia Pacific All Cap Index factsheet, 29 August 2025.
Smart Europe ETF
The Smart Europe ETF (EUF) was established in July 2015 and is designed to track the return (before tax, fees and other expenses) of the FTSE Developed Europe All Cap Index. The annual fee is 0.55%.4 The fund holds the US-listed Vanguard FTSE Europe ETF. The Index is comprised of large, mid and small capitalisation companies located in European countries.
The fund provides exposure to 16 markets across Europe. The top four markets in the fund, the UK, France, Germany and Switzerland, together represent 68% of the portfolio. There are 1,203 companies in the portfolio. The top 10 holdings represent 16.9% of the portfolio. The five largest companies are ASML Holding, SAP, AstraZeneca, Nestle, and Novartis.6 Find out more about the Smart Europe ETF here
Smart Europe ETF – Market exposures
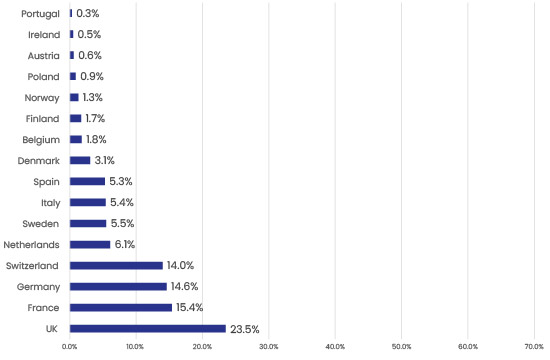
Source: FTSE Russell. FTSE Developed Europe All Cap Index factsheet, 29 August 2025.
Smart Emerging Markets ETF
The Smart Emerging Markets ETF (EMF) was established in July 2015 and is designed to track the return (before tax, fees and other expenses) of the FTSE Emerging Markets All Cap China A Inclusion Index. The annual fee is 0.59%.4 The fund holds the US-listed Vanguard FTSE Emerging Markets ETF. The Index is comprised of large, mid and small cap companies located in emerging markets around the world.
The fund provides exposure to 23 emerging markets. China is the largest exposure with a weighting of 34.0%. The three largest markets, China, Taiwan and India, together represent 74.7% of the portfolio. There are 4,801 individual companies in the index. The top 10 holdings represent 24.2% of the portfolio. The five largest companies are Taiwan Semiconductor, Tencent Holdings, Alibaba Group Holdings, HDFC Bank and Xiami Corp.7 Find out more about the Smart Emerging Markets ETF here
Smart Emerging Markets ETF – Market exposures
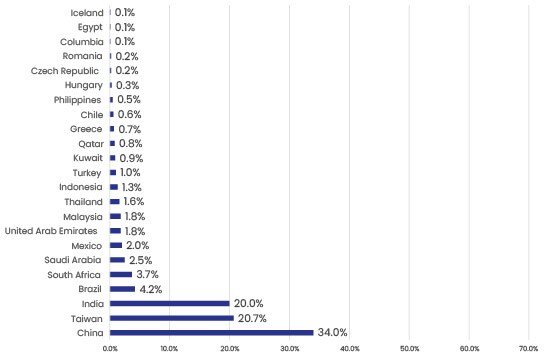
Source: FTSE Russell. FTSE Emerging Markets China A Inclusion Indices factsheet, 29 August 2025.
Unlisted fund options also available
Alongside the Smart ETFs discussed above, we also have multi-rate Portfolio Investment Entities available for clients who prefer unlisted funds. These are offered within our SuperLife range of funds and have the same exposure as the corresponding Smart ETFs.
Find out more about SuperLife unlisted funds here.
Regional funds
Fund | Annual fee |
|---|---|
SuperLife Total World Fund | 0.48% |
SuperLife US 500 Fund | 0.44% |
SuperLife Asia Pacific Fund | 0.49% |
SuperLife Europe Fund | 0.49% |
SuperLife Emerging Markets Fund | 0.63% |
Global diversification for the long run
Diversification remains a key strategy for long-term investors. Whether clients access global markets through a single global fund or a tailored mix of regional funds, a key principle to keep in mind is maintaining broad diversification across markets. Smart makes it easy to build a portfolio designed for the long term.
Footnotes
Smartshares Limited is also the manager and issuer of the SuperLife Invest scheme, the latest product disclosure statement for SuperLife Invest is available at superlife.co.nz/legal.
Figures to 29 August 2025. Returns are after fees, before tax. The five-year annual returns for the three regional funds used in the average are Smart Asia Pacific ETF 10.45%, Smart Europe ETF 13.57% and Smart Emerging Markets ETF 8.28%. smartinvest.co.nz/funds-and-performance/etf-performance.
The term ‘magnificent seven’ was coined by Michael Hartnett, chief investment strategist at Bank of America, in May 2023. The man behind ‘The Magnificent Seven’ | Reuters
Smart Exchange Traded Funds Global Series Product Disclosure Statement, 22 September 2025. Fees are percent per annum of the fund’s net asset value. smartinvest.co.nz/resources/documents.
Holdings information from FTSE Russell. FTSE Developed Asia Pacific All Cap Index factsheet, 29 August 2025.
Holdings information from FTSE Russell. FTSE Developed Europe All Cap Index factsheet, 29 August 2025.
Holdings information from FTSE Russell. FTSE Emerging Markets China A Inclusion Indices factsheet, 29 August 2025.
Disclaimer
This information is issued by Smartshares Limited (Smart), a wholly owned subsidiary of NZX Limited. Smart is the issuer and manager of the Smart Exchange Traded Funds. The product disclosure statements are available at smartinvest.co.nz.
Past performance is not a reliable guide to future performance. The calculations and returns used in this article are illustrative and intended as a guide only, and are not an indicator of future returns. The value of investments can go down as well as up and investors may not get back the full amount invested nor any particular rate of return referred to in this article. Returns are not guaranteed.
This information is intended to provide a general guide and is based upon, and derived from sources Smart considers reliable. Neither Smart nor NZX Limited, or their respective directors and employees accept any liability for any errors, omissions, negligent misstatements, or for the results of any actions taken, or not taken in reliance on this information.
This information is not a substitute for professional advice. In preparing this information Smart did not take into account the investment objectives, financial situation or particular needs of any particular person. Accordingly, before making any investment decision, Smart recommends seeking professional assistance from a licensed Financial Advice Provider.
Related articles
 A closer look at the Smart US Technology (NZD Hedged) ETFThe Smart US Technology (NZD Hedged) ETF provides targeted exposure to some of the world's most influential and innovative companies.
 Emerging Markets: A strong opportunity for 2026 Smart Chief Investment Officer, Stuart Millar shares his view on emerging markets and why they are on our radar for 2026.
  Why global markets are looking beyond the oil shockGlobal share markets have held firm despite rising oil prices and Middle East tensions. Marek Krzeczkowski, Head of Investment Strategy & Quant, explo...